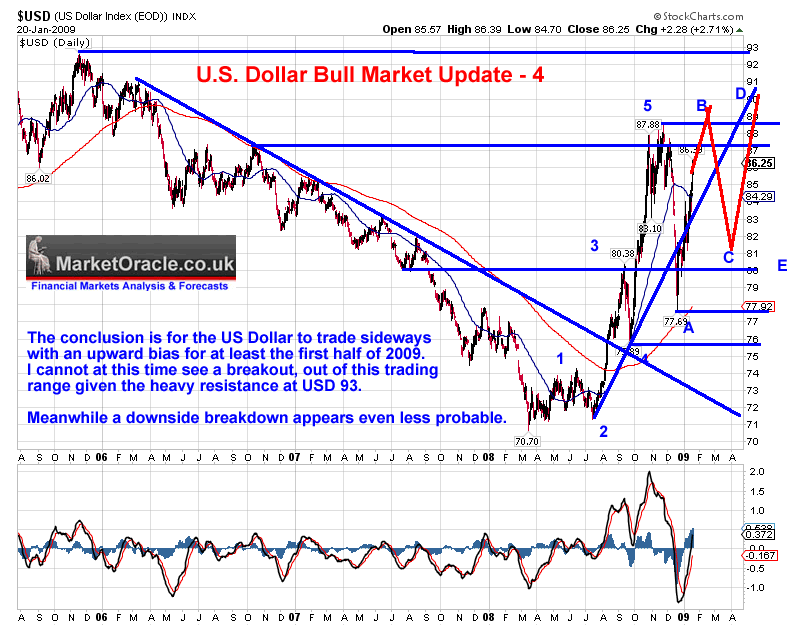
This analysis seeks to update the existing U.S. dollar analysis of January 2009 by evaluating whether or not the U.S. Dollar bull market remains intact and to project a trend for the USD into year end. The sideways trend of the USD for the past 6 months in the wake of the "Quantitative Easing" headlines that has repeatedly brought the Dollar collapse proponents back out of hibernation on each down leg has shown little deviation from the road map of 20th Jan 09 as illustrated by the below original price chart.
But firstly, Mike Shedlock writes in an recent article that both he and the Dollar bear Robert Prechter conclude that the U.S. Dollar has hit a major market bottom.
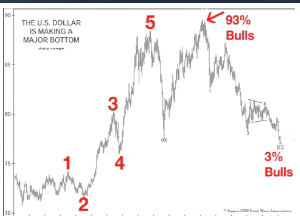
In a recent video Robert Prechter says the Dollar's Hit a "Major Bottom" and that a deflationary depression is coming.
The Dollar Sentiment Index for the Dollar Index reports just 3% bulls among traders, an extreme level only five times in the past 20 years, usually near an important low," Prechter wrote on Aug. 5. "The last time we saw readings like this was March-July 2008, just before the dollar soared." In other words, the "short the dollar" trade is overly crowded.
Its amazing how Robert Prechter's current chart matches mine of 8 months ago!, Note waves A and B to a new high for a flat correction. Though the fact of the matter is that the U.S. Dollar actually bottomed in March 2008 and has been in a bull market ever since, with corrective sideways price forecast for the first half of 2009.
Summary of Key USD Bull Market Analysis
Update 4 - January 2009 - USD Sideways consolidation trend into July / August 2009 (US Dollar Bull Market 2009 Update 4)
Update 3 - October 2008 - Expecting USD to correct after rallying to between 87and 90, targeting support at 80, to be followed by a resumption of the up trend targeting USD 92. ( U.S. Dollar Bull Market Update )
Update 2 - August 2008 - Dollar Base building complete - breakout targeting USD 80 ( The US Dollar Bull Market )
Update - 1 March 2008 - Dollar Bear Market Bottom called, initial target of 80. ( DELEVERAGING- Gold and Commodities Teetering on the Brink of a Bear Market?)
U.S. Dollar Analysis and Forecast for the Second Half 2009

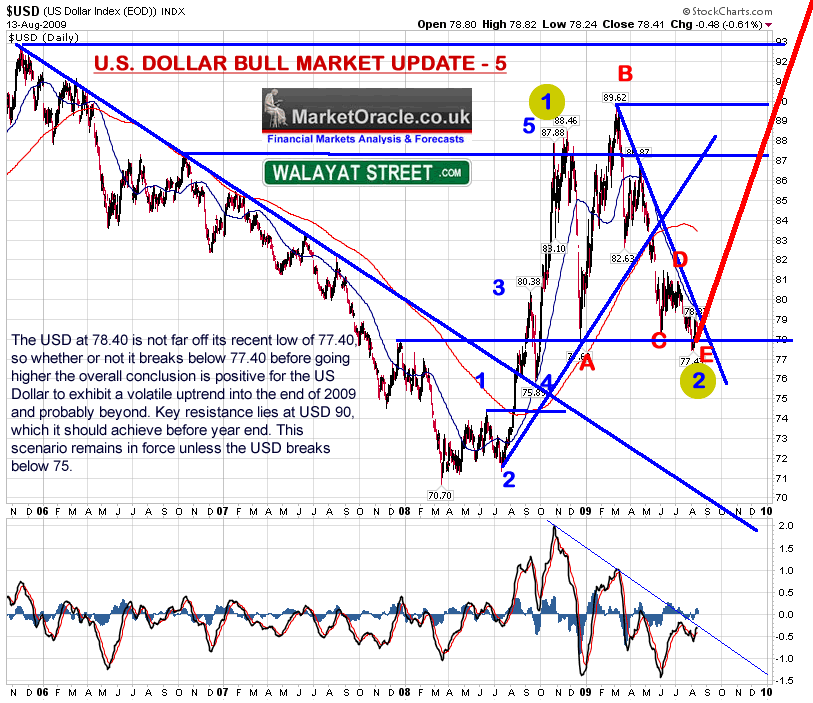
DEVIATION FROM THE FORECAST - The USD trend tracked the forecast trend quite closely up until failure at D, which implies significant weakness, however that has been in part offset by the shallow subsequent dollar trend into E to complete the forecast period. Overall the impression is of a more weak outcome than anticipated in January therefore signaling caution against an overly optimistic outlook for the second half of 2009.
ELLIOTT WAVE THEORY - The anticipated correction over the first half of 2009 has developed into a clear A-B-C-D-E correction pattern as labeled on the chart (alternative interpretation is A-B-C(5 waves)). This implies that we should now be in store for a powerful impulse wave higher to rival the 2008 Wave1, though I expect this to be far more complex in nature than the more easily interpreted Wave 1, which suggests that the actual wave structure may break elliott wave tenants so as to confuse elliott wave technicians, much as occurred with the Gold bull analysis of January 2009 -Gold Price Forecast 2009 , to which I need to remind readers that the price does not care for tenants, therefore tune yourself to the market your trading rather than the theory your applying!
TREND ANALYSIS - The bear trend following the higher peak at B has accumulated many bearish positions as a consequence of being greater in time than the preceding swift uptrend into B. This implies that the market is ripe for a swift trend reversal higher. As with the higher high at B that failed to follow through, the lower low at E has also failed to follow through to the downside, and hence is inline with that for which is required for a trend reversal higher from a state of a maximum bearish pattern, as many would have seen the break below 78 as a signal for a significantly lower USD.
SUPPORT / RESISTANCE - Immediate support is at the most recent low of 77.40 and further out at 75.80, which should contain any near-term weakness. Resistance is at 81 which would act as a good confirming trigger for a sustained advance towards key resistance at USD 90, and still higher at USD 93.
PRICE TARGETS - On confirmation of the uptrend on break of 81, the USD would clearly be targeting 90. On break of which USD 93, and then USD 100. On the downside the whole scenario would be negated on break below 75 which would target an assault on USD 70.
MACD - The downtrend from B has depressed the MACD to a perpetual oversold state, which gives plenty of room for a sustained and swift dollar uptrend, meanwhile downward pressure remains weak, which implies that even if the dollar takes some time to make its mind up, the downside looks limited therefore suggesting a worse case scenario of a sideways trend for a month or two. There also exists a significant downtrend line on break of which would signal a CHANGE in the nature of the USD from bearish trend to a bullish trend, and given the proximity of the trendline that signal could occur within a matter of days!
CYCLES - There does appear to be a weak 2.5 month low to low cycle which given that the last low was 2months from the preceding low does put the USD in the time window for making a cycle low and therefore implies that the USD may already have made a low at USD 77.40.
SEASONAL TREND - The seasonal trend is for the USD to significantly weaken between August and October 2009. Therefore the analysis so far is against the seasonal trend outlook. However note that the we are looking at a new U.S. Dollar bull market so there it is expected that the trend will be contrary to the seasonal trend which is built upon many years of bearish data.
FUNDAMENTALS - The leading indicator of economic activity, the Stock markets which bottomed in March as per the analysis Stealth Bull Market Follows Stocks Bear Market Bottom at Dow 6,470 , most small investors / traders are still hooked on the pervading bearish commentary and await positive data that the economies are recovering. However by the time the data is revealed the markets will have already moved. Therefore viewing fundamental data at important market junctures continues to be a pointless exercise much as I voiced for stocks in March 2009 and now for the USD in August as the pervading fundamentals (old news) are still predominantly bearish i.e. a mix of record budget deficits and Q&E.
Conclusion
The USD at 78.40 is not far off its recent low of 77.40, so whether or not it breaks below 77.40 before going higher, the overall conclusion is positive for the US Dollar to exhibit a volatile uptrend into the end of 2009 and probably beyond. Key resistance lies at USD 90, which it should achieve before year end. This scenario remains in force unless the USD breaks below 75.
The implications of a dollar bull run is generally bearish for commodities such as gold, which I will cover in a future newsletter (subscribe to my always free newsletter to get this analysis in your in box) as well as a trend forecast for the British Pound.


Sem comentários:
Enviar um comentário