As a rule, crime and social protest rise in periods of economic crisis in capitalist society. During times of economic and social instability, the well-to-do become increasingly fearful of the general population, more disposed to adopt harsh measures to safeguard their positions at the apex of the social pyramid. The slowdown in the economic growth rate of U.S. capitalism beginning in the late 1960s and early 1970s — converging with the emergence of radical social protest around the same period — was accompanied by a rapid rise in public safety spending as a share of civilian government expenditures. So significant was this shift that we can speak of a crowding out of welfare state spending (health, education, social services) by penal state spending (law enforcement, courts, and prisons) in the United States during the last third of a century.1
With the U.S. economy now experiencing economic depression/stagnation on a scale not witnessed since the 1930s, the vicious circle of slow growth/expanding inequality on the one hand, and increasing state repression of the working population on the other, which has characterized the neoliberal era, is bound to worsen — barring a major change in social relations. The role of penal state spending is therefore crucial to understanding the developing crisis of U.S. class society.
The Civilian Government/GDP Ceiling and Penal State Spending
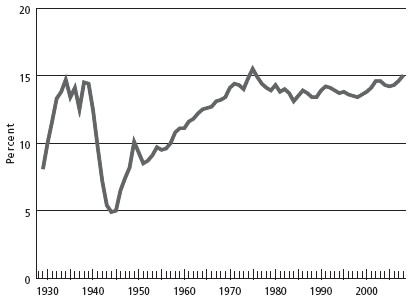
In “A New New Deal under Obama?” (Monthly Review, February 2009) two of us noted that non-defense government spending has more or less hovered around 14 percent of GDP for the past forty years.2 (See chart 1.) Meaningful progressive policies invariably require an increase in civilian government spending — in fact, this becomes a key barometer to measure the material success of progressive organizing and working-class politics. Civilian government spending as a percentage of GDP reached the 14.5 percent level in 1938–39, at the height of the New Deal. It declined sharply at the time of the Second World War, but returned to about 14 percent in the 1970s, where it has basically remained ever since.
Chart 1. Non-defense government (federal, state, and local) consumption and gross investment as percentage of GDP, 1929-2008
Sources: Bureau of Economic Analysis, National Income and Products Accounts, Table 1.1.5. (Gross Domestic Product), and Table 3.9.5. (Government Consumption Expenditures and Gross Investment).
Our argument was that there were serious domestic political pressures — in effect, the capitalist class and corporate special interests — that made it difficult, nearly impossible, for civilian government spending as percentage of GDP to rise above the 14 percent ceiling for any length of time.3 We noted that in other advanced capitalist nations, where the labor movement and left were stronger, the percentage of GDP allocated to civilian government spending tended to be considerably higher. Hence, we argued that it is extremely unlikely to get anything close to a dramatic increase in civilian government spending without an extraordinary increase in popular political organizing — far beyond what has existed in the United States for generations or what the two dominant U.S. political parties would encourage. To believe that Obama would deliver a new New Deal on his own was nonsensical, even if a significant percentage of his voters, perhaps a majority, would be delighted for him to do so.
The other main aspect of the government budget, military spending, does not generate the same opposition from elements of the capitalist class or the corporate community — quite the contrary — and therefore has no such ceiling on its growth. Hence military spending has been subject to periodic huge increases (as well as periodic declines), and has remained the main means of fiscal stimulus of the economy for the past seventy years. We chronicled the under-recognized extent of military spending in the U.S. economy in the “The U.S. Imperial Triangle and Military Spending” (Monthly Review, October 2008).4
But there was a lingering problem we had with the argument on civilian government spending. If the past three decades have been ones of retrenchment for labor and the left, growing inequality, increased power of capital over the government, and massive and successful attacks on government programs that serve the poor and working class, how could civilian government spending as a percentage of GDP have remained stable at around 14 percent? Should it not have declined?
A good part of the seeming paradox is explained by other sources of spending with very strong political backing such as various subsidies going to agriculture, highways, and business, and the need to maintain at least the basic services and workings of civilian government. While much of civilian government spending as a percentage of GDP has been constrained over the past thirty plus years — especially social services — other areas that benefit the ruling order directly have increased.
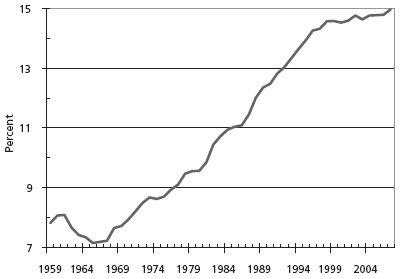
One area in particular that has been on the receiving end of ever increasing public funds has been police, courts, prisons, and jails — what is euphemistically termed “public order and safety.” As chart 2 demonstrates, the share of such penal state spending has nearly doubled as a percentage of civilian government spending over the past fifty years and now stands at 15 percent of the latter. Because total civilian government spending stayed pretty constant as a portion of GDP, this sharp increase in penal state spending has had the effect of crowding out other forms of civilian government spending.
Chart 2. Public safety as a percentage of civilian government spending
Sources: Bureau of Economic Analysis, National Income and Product Accounts, “Government Consumption Expenditures and Gross Investment,” Table 3.9.5; and “Government Consumption Expenditures and Gross Investment by Function,” Table 3.15.5.
Penal state spending is much closer to military spending than it is to other forms of civilian government spending, not only in its commitment to control via state violence (particularly where the police have themselves become increasingly militarized), but also in its freedom from barriers erected by vested interests blocking its further expansion. It faces no powerful domestic constituency that opposes expenditure in this area, as does spending on the environment, public housing, public health, mass transit, or public education. It has therefore evolved into a huge industry in its own right — one that incessantly demands that the government open the spigot ever wider. And, like military spending, it is uniquely positioned to play on jingoism and fear, with no small amount of racism for good measure. For a politician to oppose increased prison spending routinely is to invite career suicide. The recent public statements critical of the prison-industrial complex by Senator Jim Webb are striking, not only for their insight and courage, but for their isolation from virtually all other political commentary on the matter emanating from the mainstream. The penal state is as off-limits in official U.S. politics as empire; in this sense it can be regarded as the domestic side of a militarized society and an empire in decline.
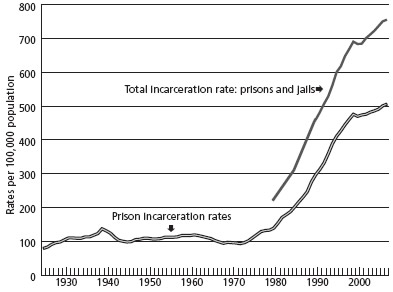
The emergence of the penal state in U.S. society is striking, and catastrophic. For much of the twentieth century, the United States imprisoned roughly the same proportion of its population as other nations. This is no longer the case. Chart 3 demonstrates the astonishing increase in incarceration rates for all adults, which began to skyrocket in the 1970s.
Chart 3. Adult incarceration rates per 100,000 population
Sources: U.S. Census Bureau, Statistical Abstract of the United States: 2009 (128th Edition), No. HS-24, “Federal and State Prisoners by Jurisdiction and Sex: 1925 to 2001”; Bureau of Justice Statistics, “Prisoners” and “Prison and Jail Inmates at Mid-year,” various issues in series.
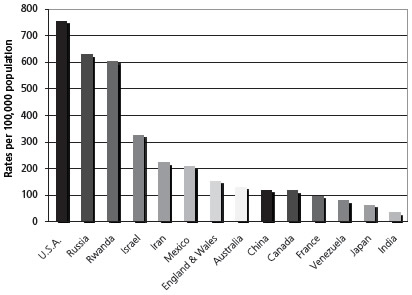
This growth becomes more dramatic when the U.S. incarceration rate is compared to that of other nations, as chart 4 demonstrates. The United States accounts for 5 percent of the world’s population, and almost a quarter of the world’s prisoners. It is number one with the proverbial bullet when it comes to locking up its own people. No thug dictator, no psychopathic madman, anywhere in the world can touch the United States in this department.5
The figures for the United States are based on the jail and prison population totaling 2,293,157 in 2007. This doesn’t even include the 119,955 reported detainees held in territorial prisons, jails in Indian country, U.S. Immigration and Customs Enforcement (ICE) facilities, military prisons, and juvenile detention centers.6
Chart 4. World incarceration rates per 100,000 population, select countries
Source: Roy Walmsley, International Centre for Prison Studies, “World Prison Population List (8th edition),” January 2009.
The neoliberal offensive that followed the economic slowdown and the social protests of the 1960s and early ’70s resulted in an expanded definition of crime and increasing sentences. The change was most evident in the epidemic incarceration of the population for drug-possession offenses in the 1970s and ’80s, which, combined with onerous mandatory sentences, was the dynamite for the prisoner explosion. Incarcerated drug offenders have soared 1,200 percent since 1980.7 Those in prison due to drug possession now account for 53 percent of all federal prisoners, and 20 percent of state prisoners.8 These offenses were victimless, and nonviolent. “When I started as a police reporter,” David Simon, former Baltimore Sun journalist turned creator of the TV program The Wire, said, “33, 34 percent of the federal inmate population was violent offenders. Now it’s like, seven to eight percent.”9
The “war on drugs” proved to be most successful when the drug users were poor and working class. “I saw more drug use at Georgetown University Law Center when I was a student there than I’ve seen anywhere else in my life,” Senator Webb says. “And some of those people are judges.”10
Chart 5. Crime rate per 100,000 population since 1960*
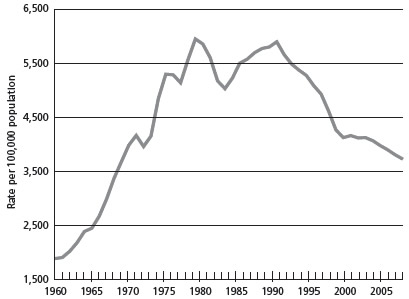
*Note: The FBI’s Uniform Crime Report uses property and violent crimes, which are referred to as “index crimes,” to construct the crime rates.
Sources: U.S. Census Bureau, Statistical Abstract of the United States: 2009 (128th Edition), No. HS-23, “Crimes and Crime Rates by Type of Offense: 1960 to 2002”; U.S. Federal Bureau of Investigation, “Crime in the United States,” various issues in series.
The plot thickens as we look at chart 5. The crime rate per 100,000 population — calculated in the official series based on property and violent crimes, taken as indices of crime in general — peaked some two decades ago, yet the incarceration rate as we have seen, continued to shoot up. The “prison-industrial” complex thus took on its own logic. It required additional bodies to justify the expanding budgets and profits. A prison has come to serve the same function as a military base in the economic lifeblood of numerous communities across the nation. “I can get $600,000 from the state for a new jail,” one Maryland mayor recently said, “but I can’t get $40 for Healthy Families,” a public health program for infants.11
Neoliberalism and the Punitive Turn
It was not a mere coincidence that the explosion in the prison population coincided with the emergence of neoliberalism as the reigning philosophy in the United States. Neoliberalism, in essence, is capitalism with the gloves off, a political regime where the interests of capital are elevated and the interests of the working class are demonized and demolished. It was the main political-economic response of the system to the slowdown of economic growth in the early 1970s, which has persisted and indeed worsened since. It was also meant to counter the 1960s and early 1970s era of social protest. To some extent the drug war can be understood as a classic case of the phony moralism that thrives as a distraction in neoliberal times, covering up the real failures of capitalist society. But there are two other, even more direct ways in which neoliberalism is crucial to explaining the expansion of the penal state.
First, neoliberalism, although initially a response to economic slowdown, represented a kind of revolution-in-reverse in U.S. society, promoting social control and profitability on behalf of society’s overlords through a “war on crime,” amongst other means. The rise of neoliberalism, in response to economic stagnation tendencies, has been marked by a shift of income and wealth to the very top and the increased impoverishment the further one goes down the economic pecking order. Studies show that those nations with the highest rates of inequality also tend to have higher rates of incarceration, with the United States representing an extreme on both counts.12 Inequality and prison admission are so closely correlated that a recent study of U.S. wage, employment, and incarceration rates concluded: “empirical analysis suggests that if levels of economic inequality that were observed in the mid-1980s prevailed through the 1990s, prison admission rates among black and white men without college education would be reduced by 16–25%.”13
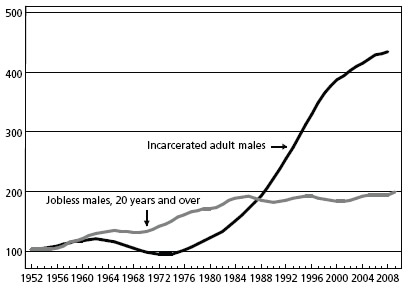
Bernie Madoff notwithstanding, prisoners come almost entirely from the poor and working class. Rising incarceration rates reflect in the first instance a rising industrial reserve army of the unemployed/underemployed. Thus there is normally a close relationship between inequality, joblessness, poverty, crime, and incarceration. Chart 6 shows the long-term relationship between the jobless rate for civilian, non-institutionalized men on the one hand, and the federal and state incarceration rate for the adult male population on the other, from the early 1950s until the present (1948 = 100, five-year moving averages). The jobless rate in this sense should not be confused with the common use of “joblessness” to refer to unemployment, which only includes those who are officially counted as belonging to the labor force and who are also without jobs. Rather the jobless rate looks at the overall share of adults who are jobless, thereby capturing the larger economically marginalized population.14
Up until the mid-1980s, as can be seen in the chart, changes in the jobless rate for men and the incarceration rate for men follow a similar pattern. The close relationship between trends in joblessness and incarceration evident in this period reflects both economic fluctuations and the fact that prisoners tend to come from the most economically vulnerable populations in the society. As Berkeley sociology professor Loïc Waquant, known for his research on the U.S. penal state, has recently noted, “fewer than half of inmates [in U.S. prisons] held a full-time job at the time of their arraignment and two-thirds issue from households with annual income amounting to less than half of the so-called poverty line.”15
Yet, beginning around 1985, as chart 6 also shows, incarceration took on a life of its own, soaring off into the stratosphere, quite apart from joblessness, which rose much more slowly. This reflected what Glenn Loury, Merton P. Stoltz Professor of Social Sciences in the department of economics at Brown University, has referred to in his Race, Incarceration, and American Values as the “punitive turn” in the mid-Reagan period. The key change was the passage of the 1984 Sentencing Reform Act implementing new “federal sentencing guidelines.” These were in fact not so much “guidelines,” but new mandates that compelled judges to implement maximum sentences. Subsequently, there has been a continual stiffening of sentences for offenders. The passage of “three-strikes” legislation in most states in the 1990s constituted a further intensification of this punitive turn, resulting in much higher levels of incarceration.16
As Marx noted in 1859 in the New York Daily Tribune: “Violations of the law are generally the offspring of economical agencies beyond the control of the legislator, but it...depends to some degree on official society to stamp certain violations of its rules as crimes or transgressions only. This difference of nomenclature, so far from being indifferent, decides on the fate of thousands of men.” Thus, what were previously minor transgressions, such as drug use charges, became in the 1980s full-fledged crimes. This, together with increased use of maximum sentencing provisions, led to a vast increase in the incarceration rate in U.S. society.17
Chart 6: Changes in jobless rate for males (20 years and over) and in males in federal and state prisons as percentage of adult male population
1948 = 100, 5 Year Moving Averages
Sources: U.S. Census Bureau, Statistical Abstract of the United States: 2009 (128th Edition), No. HS-24, “Federal and State Prisoners by Jurisdiction and Sex: 1925 to 2001”; Bureau of Justice Statistics, “Prison and Jail Inmates at Mid-year, 2008”; U.S. Census Bureau, “Annual Population Estimates by Sex and Age,” various releases (population data for 2008 are projected); Bureau of Labor Statistics, (figures not seasonally adjusted).
The harsh reality of neoliberalism’s “punitive turn” in the 1980s and ’90s remains below the radar of a majority of people in U.S. society. The devastated population that fills our prison cells has little commercial or political influence, buying relatively little and voting infrequently — if even permitted to do so. Hence the news media almost never cover this issue. Imagine the press coverage if the prison population was drawn almost entirely from the upper-middle class! Politicians with rare exceptions regard prisoners as dangerous animals to be contained and coerced rather than fellow humans. Rehabilitation has thus gone out the window. As the conservative Harvard professor James Q. Wilson openly declared in 1975 in his Thinking About Crime, the goal should be to “isolate and punish” since “society really does not know how to do much else.”18
Second, neoliberalism is devoted to turning any public sector undertaking that can be profitable over to capitalists. Here we see the seamy underside of the system: beneath all the highfalutin lectures on hard work, efficiency, free markets, competition, and accountable government, is the deeper reality of routinized corruption, of public monies diverted into rich people’s pockets.
The booming prison sector has been increasingly privatized and put to use to support the needs of capital. In the 1970s, along with growing reliance on private contracts to provide prison services (like meals, transportation, and health care), the first completely privately owned and operated high-security institutions came under contract with the state. Juveniles and immigrants were the first to be locked up in completely privatized facilities. Testing privatization on the most vulnerable and politically disenfranchised groups gave private companies the foothold necessary to become part of the conversation about what to do with the rising costs of imprisonment. The increasing costs, of course, were themselves predicated upon skyrocketing incarceration rates, translating into booming demand for the prison services industry.
Because privatization of prisons is objectionable to many on ethical and moral grounds, even to those who support capitalism otherwise, corrections were attacked as grossly inefficient, requiring intervention by the more streamlined private sector. The most common fantastical figure bandied around by privatization advocates was that private prisons would save the state as much as 20 percent in costs. Consequently full privatization of prisons, though still far from constituting a majority of facilities, began in earnest.
The actual truth is that privatization of prisons produces almost no savings, as a 2001 study under the aegis of the U.S. Department of Justice entitled “Emerging Issues on Privatized Prisons” demonstrated.19 The study added that what savings the private firms did generate came almost entirely through lowering wage costs; i.e., smashing the prison guard unions. The similarity to efforts to privatize other public services, like education, is evident.
What is clear, however, is that the private prison industry has tremendous incentive to increase the use of prison labor in the marketplace, and derives much of its force from this fact. Already thirty-seven states have legalized the contracting of prison labor by private firms.20 Nor is the private sector alone exploiting prison labor; already a significant portion of military equipment is produced in federal prisons.
Much like the military sector and the health insurance sector, the prison-industrial complex, both private and public, has become a major industry, with the standard accoutrements of conventions, trade shows, and Wall Street investment analysts devoted to it. It has its golden revolving door from public to private sector. Most important, it has become a tremendously powerful lobbying force in Washington and state capitals across the nation. It requires, as we have seen, not only public money, but bodies to justify that money. It has taken on a life of its own.
Prison Conditions and Racism
Fyodor Dostoevsky once observed that “The degree of civilization in a society is revealed by entering its prisons.”21 So what would we find?
By nearly all accounts the conditions in U.S. prisons are deplorable and getting worse. They do a better job of converting first-time offenders into seasoned criminals than in assisting prisoners to become gainfully employed. This plays into the nineteenth-century meme (going back to the New Poor Law of 1834) that prisons should be a horrific experience for prisoners and abuse them to such an extent that they will do anything to avoid them. It did not work in Dickens’s time, and it does not work today.
The latest national study of U.S. recidivism revealed that of prisoners released in 1994, within three years: 67.5 percent were rearrested for a new offense; 46.9 percent were reconvicted for a new crime; 25.4 percent were resentenced to prison for a new crime; and 51.8 percent were back in prison, “serving time for a new prison sentence or for a technical violation of their release, like failing a drug test, missing an appointment with their parole officer, or being arrested for a new crime.”22 These rates of recidivism are among the highest in the world, with Britain being the only possible rival for the top position.
Along with losing productive time in prison and not gaining the necessary skills and tools to re-enter society in a positive way, many prisoners exit prison with even less of a life intact, no safety net, no place or means to survive while trying to get their lives in order. To make matters worse, research shows that the legal status of people with conviction records makes it improbable that many released prisoners will ever make it in society.
One important report, entitled After Prison, indicates that, “rather than helping them successfully transition from prison to community, many current state and federal laws have the opposite effect, interfering with the rights and obligations of full citizenship in nearly every aspect of people’s lives. These laws diminish public safety and undermine the nation’s commitment to justice and fairness, creating roadblocks to basic necessities for hundreds of thousands [even millions] of individuals who are trying to rebuild their lives, support their families, and become productive members of communities.”23
“Post-incarceration re-entry programs are haphazard and often nonexistent,” Senator Webb notes, “making it extremely difficult for ex-offenders to become full, contributing members of society.”24
Prisons have had to take up much of the brunt of cutbacks in spending on the mentally ill in the neoliberal era. Four times as many mentally ill people are in prisons than in mental health hospitals. One-sixth of all prisoners suffer from mental illness of one sort or another.
More than 20 percent of prisoners report they have been sexually assaulted by guards or fellow inmates.25
Were Dostoevsky to witness such barbarism he would undoubtedly pronounce civilization long dead in the United States, and regard the self-congratulatory tone of U.S. society as a supreme irony.26
Yet none of the above captures the greatest ignominy of the prison crisis in the United States: the prison population is disproportionately African-American and nonwhite. By disproportionate, we mean not only in relation to the population as a whole, but also in relation to the population of poor and working-class people. It is impossible to look at the prisoner explosion without seeing racism in all its fury. Fully three-quarters of all prisoners locked up for drug-related charges are African-American.27 In the late 1990s, for black men in their thirties, prison records were nearly twice as common as bachelor’s degrees. “Among all men, whites in their early thirties are more than twice as likely to hold a bachelor’s degree than blacks. Blacks are about 50 percent more likely to have served in the military. However, black men are about 7 times more likely to have a prison record.”28 And, the likelihood of imprisonment is increasing.
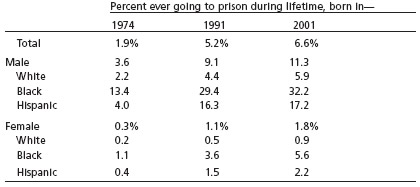
In 2003, the U.S. government’s Bureau of Justice Statistics issued an updated report entitled, The Prevalence of Prison in the United States, 1974-2001. As table 1, based on this report indicates, if incarceration rates remained at the 2001 level, 32.2 percent of black males born in 2001 would be expected to go to prison, as would 17.2 percent of Hispanic males, and 5.9 percent of white males. For women, all things remaining the same, 5.6 percent of black females would go to prison, 2.2 percent of Hispanic women, and only 0.9 percent of white females. Of course, all things have not remained the same, incarceration rates have continued to climb. And, these figures do not include jails, which house close to a third of all U.S. inmates. Combining expectations for jail experience and the continued increase in imprisonment rates, we can only assume that these figures are major underestimates of the foul life chances and dim futures on offer to so many of the children we now see playing on under-funded school grounds.
Table 1. Projections of likelihood to be incarcerated for children of various age cohorts
Source: Bureau of Justice Statistics, “Prevalence of Imprisonment in the U.S. Population, 1974-2001,” (2003).
Although recent trends are alarming, they were a long-time coming. The best report furnished by the Bureau of Justice Statistics for looking at the long-term racial disparities between whites and blacks in prison, runs from 1926-86. (See chart 7.) Due to changes in the Bureau of Justice data, we had to finish the series (after 1986) using percentages of the actual prison population, rather than the race of those admitted as in the original statistics. The dotted vertical line in the chart reflects this discontinuity in the official data. Nevertheless, the long-term trend presents a coherent picture. As you can see from when the data was first reported until the present the trend has been toward minorities making up a larger and larger percentage of persons admitted to state and federal prisons, now constituting about two-thirds of the total. Blacks now make up more than a third of the prison population, and the percentage of Hispanic and “other” are on the rise in relation to whites.
Chart 7. Percent of state and federal prisoners by race, 1926-2006*
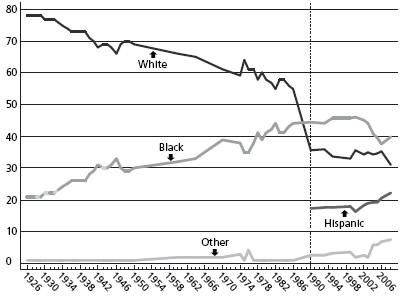
*After 1986, the categories white, black, and other exclude Hispanics.
Sources: Bureau of Justice Statistics, “Race of Prisoners Admitted to State and Federal Institutions, 1926-86,” (1991); Bureau of Justice Statistics, “Prisoners,” various issues in series, “Correctional Populations in the United States,” various issues in series, and “Prison and Jail Inmates at Mid-year,” various issues in series, (older issues are not available online).
In 1926 the federal and state imprisonment rates per 100,000 population were estimated at: whites, 36; blacks, 106; and other, 62. (Local jail detention figures are unavailable.) Today, the total incarceration rate per 100,000 individuals, including federal and state imprisonment and local jail detention, is: whites, 820; blacks, 5,126; and Hispanic, 1,907. Latinos/as represent the fastest growing segment of the minority prison population, rising from 5 percent of federal and state inmates in 1978 to 21 percent in 2007.29 “The incarceration rate of American Indians and Alaska Natives,” as noted in a 2007 article in Criminal Justice Studies, “is 19 percent higher than the national rate.”30 In the last decade, according to Amnesty International, the number of immigrants in detention has tripled from 10,000 in 1996 to over 30,000 in 2008.31
To add insult to injury, the United States is one of the few nations that prohibits prisoners from voting, and in some states the ban is lifelong. Nearly 2.5 percent of U.S. adults and fully 14 percent of black men are now disenfranchised because of criminal convictions. In the crucial Florida election of 2000 that resulted in George W. Bush becoming president, at least 11 percent of that state’s adult black population was disenfranchised as a result of felon disenfranchisement laws as opposed to around 4 percent of the non-black population. Altogether current laws disenfranchise over five million U.S. voting age citizens, according to the Sentencing Project.32
Smashing the Penal State
In our view, as depressing as the picture is, it is not hopeless. Worsening economic crisis, the failure of neoliberalism’s punitive turn, and rebellion from below could, in a reversal of fortunes, create the basis for radical change. Penal state spending could be crowded out by renewed welfare state spending—or by more fundamental changes in the social structure of power in U.S. society.
We may be approaching a moment where it will be possible to open up a debate on the obscenity and absurdity of the present order and its punitive social control mechanisms. The current economic crisis is putting states and municipalities in a very difficult position. They have sharply declining revenues but the social needs of their struggling populations are escalating. If today’s state and local governments follow business-as-usual, and use their shrinking revenues to cut back on necessary social programs to bankroll their bloated prison systems, support for public safety spending amongst the overall population may falter. More and more people may conclude that the United States cannot afford its prison-industrial complex any more than its military-industrial complex, given pressing social needs.
Already, in 2009, there are cracks in elite opinion that has been quiet heretofore on the prison crisis, though they still remain on the margins with Jim Webb. The left must play a leadership role in this campaign. Smashing the penal state is job one for socialist politics as we put the neoliberal hell in our rearview mirrors. Workers cannot remain free while millions of their brothers and sisters are imprisoned. We need our own Bastille Day.
Notes
- We have taken the term “penal state” from Loïc Wacquant, “Ordering Insecurity: Social Polarization and the Punitive Upsurge,” Radical Philosophy Review 11, no. 1 (2008), 9-27. Unlike Wacquant, however, our object here is not to present an all-encompassing theory of the penal state as representing a stage in the development of the state as a whole. Rather, we use the term in this article in a more limited way as a parallel concept to that of the welfare state. Thus “penal state spending,” as we employ it, is conceptually equivalent to “public safety spending” and is to be juxtaposed to “public welfare spending.” Go back
- John Bellamy Foster and Robert W. McChesney, “A New New Deal Under Obama?” Monthly Review 60, no. 9 (February 2009): 1-11. Go back
- In 1934 and 1975 temporary peaks in civilian government spending as a percentage of GDP of around 15 percent resulted from the fact that private production and consumption as percentages of GDP contracted faster than the civilian government share. This was followed in both cases by a reversion to the mean in the share of civilian government spending. With civilian governments spending as a percentage of GDP in 2008 at 15 percent a similar dynamic may well be at work. Go back
- John Bellamy Foster, Hannah Holleman, and Robert W. McChesney, “The U.S. Imperial Triangle and Military Spending,” Monthly Review 60, no. 5 (October 2008): 1-19. Go back
- Roy Walmsley, International Centre for Prison Studies. “World Prison Population List, (8th edition),” January 2009. For a historical view on incarceration in the United States since its founding see John Bellamy Foster, Harry Magdoff, and Robert W. McChesney, “Prisons and Executions — the U.S. Model,” Monthly Review 53, no. 3 (July-August 2001): 1-18. Go back
- Bureau of Justice Statistics, “Prisoners in 2007,” Tables 8 and 10 (version revised February 12, 2009). Go back
- Michael K. Fauntroy, “Toward Reform of Criminal Justice,” Washington Times, April 28, 2009. Go back
- Bureau of Justice Statistics, “Prisoners in 2007,” Appendix Tables 11 and 12 (version revised February 12, 2009). Go back
- Interview with David Simon, Bill Moyers’ Journal, PBS broadcast, April 17, 2009. Go back
- Quoted in Christopher Hayes, “Webb’s Prison Crusade,” The Nation, May 4, 2009. Go back
- Quoted in Ibid. Go back
- For a chart on imprisonment and inequality of various countries see www.equalitytrust.org.uk/why/evidence/imprisonment. Go back
- Bruce Western, Meredith Kleykamp, Jake Rosenfeld. “Did Falling Wages and Employment Increase U.S. Imprisonment?” Social Forces 84, no. 4 (2006): 2306. Go back
- On the jobless rate see “Notes from the Editors,” Monthly Review 60, no. 11 (April 2009). Go back
- Loïc Wacquant in Glenn C. Loury, Race, Incarceration and American Values (Cambridge, Mass.: MIT Press, 2008), 60. Go back
- Loury, Race, Incarceration and American Values, 11: Gerald Shargel, “No Mercy,” Slate, June 14, 2004. Go back
- Karl Marx and Frederick Engels, Collected Works, vol. 16(New York: International Publishers, 1975), 489. Go back
- James Q. Wilson, Thinking About Crime (New York: Basic Books, 1975, 172. Go back
- Bureau of Justice Assistance, “Emerging Issues on Privatized Prisons” February 2001. Go back
- Vicky Pelaez, “The Prison Industry in the United States: Big Business or a New Form of Slavery?” Global Research, March 10, 2008. Go back
- Quoted in Howard Zinn, A People’s History of the United States (New York: Harper Collins, 2003), 515. Go back
- Bureau of Justice Statistics. “Recidivism of Prisoners Released in 1994,” June 2002. Go back
- Legal Action Center. “After Prison: Roadblocks to Reentry” 2004.
- See webb.senate.gov/email/criminaljusticereform.html. Go back
- “A Nation of Jailbirds,” The Economist, April 2, 2009. Go back
- On the horrendous conditions in U.S. prisons see John J. Gibbons and Nicholas de B. Katzenbach, co-chairs, Confronting Confinement: A Report of the Commission on Safety and Abuse in America’s Prisons (New York.: Vera Institute of Justice, 2006); Michael Santos, Inside: Life Behind Bars in America (New York: St. Martin’s Press, 2006). Go back
- “A Nation of Jailbirds,” The Economist, April 2, 2009. Go back
- Becky Pettit and Bruce Western, “Mass Imprisonment and the Life Course: Race and Class Inequality in U.S. Incarceration,” American Sociological Review 69 (2004): 151-69, 164. Go back
- U.S. Bureau of Justice Statistics, Prisoners in 1978 and Prisoners in 2007; José Luis Morína, “Latinos/as and U.S. Prisons,” Latino Studies, 6 (2008), 11-34. Go back
- David V. Baker, “American Indian Executions in Historical Context,” Criminal Justice Studies 20, no. 4 (2007): 351. Go back
- Amnesty International, “Migrants Languish in Detention in US,” March 26, 2009. Go back
- Pamela S. Karlan in Loury, Race, Incarceration and American Values, 48-49; “A Nation of Jailbirds,” The Economist, April 2, 2009; “Felony Disenfranchisement,” The Sentencing Project. Go back





Sem comentários:
Enviar um comentário